
Quick Answer
Related Godrej projects nearby:
Godrej Bandra Reclamation — Sea-Facing 4 BHK, Mumbai →Godrej Trilogy – Worli, Mumbai →Godrej Horizon – Wadala Mumbai →
MMR housing sales in Q3 2026 reached about 31,750 units (Anarock), up 5% year on year and the highest of India’s top seven cities. Knight Frank counts 72,804 sales from January to September, the best nine months since 2018. Prices rose about 5% to Rs 37,064 per sq ft, while unsold stock slipped 2%.
The July–September quarter answered a question many Mumbai buyers were asking after a soft second quarter: is demand in the Mumbai Metropolitan Region (MMR) slowing? The 2026 data says no. MMR housing sales in Q3 2026 came in at roughly 31,750 units according to Anarock, a 5% rise over the same quarter in 2025. That made MMR the single largest housing market in the country again, ahead of Bengaluru at 16,670 units.
Knight Frank’s numbers, which track a slightly different geography and method, tell the same story from another angle. The region logged 72,804 housing sales between January and September 2026, the highest nine-month volume since 2018. Quarterly sales climbed steadily from 23,185 units in Q1 to 25,449 units in Q3. At the same time, the weighted average price for Mumbai rose 5% year on year to Rs 37,064 per sq ft.
We at Godrej Properties MMR have gone through both reports to separate the headline from what actually matters to someone buying a home in Thane, Kandivali, Panvel or Navi Mumbai over the next six months. The short version: demand is steady rather than frothy, supply is rising fast, and the balance between the two is what will decide your negotiating power. For the broader picture of where the year started, see our Mumbai real estate market 2026 outlook.
MMR Housing Sales Q3 2026: The Numbers at a Glance
Two research houses publish the most-watched quarterly figures, and they rarely match exactly because they define the market differently. Anarock counts primary sales across the wider MMR, including Thane, Navi Mumbai and the outer suburbs. Knight Frank reports its own Mumbai/MMR series along with price and inventory metrics. Reading them side by side is more useful than relying on either alone.
| Metric (Q3 2026) | Figure | Change | Source |
|---|---|---|---|
| MMR quarterly sales | ~31,750 units | +5% YoY | Anarock |
| MMR new launches | ~37,500 units | +27% YoY | Anarock |
| Top-7 city sales | ~1,00,220 units | +3% YoY, +10% QoQ | Anarock |
| MMR sales, Jan–Sep 2026 | 72,804 units | +1% YoY, best since 2018 | Knight Frank |
| Mumbai weighted avg price | Rs 37,064 per sq ft | +5.0% YoY | Knight Frank |
| Unsold inventory | ~1,55,473 units | -2% YoY | Knight Frank |
| Quarters to sell (QTS) | 6.4 quarters | from 6.6 a year ago | Knight Frank |
The most important line in that table is not sales. It is launches. Developers brought around 37,500 new units to market in MMR during the quarter, 27% more than a year earlier. Launches exceeded sales by almost 6,000 units in a single quarter. Across the top seven cities, launches rose 18% to about 1,14,320 units while sales grew only 3%.
MMR and Bengaluru together accounted for 48% of all housing sales in India’s top seven cities in Q3 2026, according to Anarock.
Sales value across the seven cities rose just 2% to around Rs 1.55 lakh crore, slower than unit growth. That points to a shift in the mix toward mid-priced homes, a pattern also visible in Mumbai’s September registrations, where volume rose 5% but stamp duty fell 5%.
Why Sales Recovered After a Weak Second Quarter
Anarock’s top-seven sales grew 10% quarter on quarter, from 90,715 units in Q2 2026 to about 1,00,220 in Q3. Three forces drove the recovery in MMR specifically.
First, end-users came back. The research houses attribute much of the improvement to self-use buyers who had paused in the April–June quarter. Many of them were waiting to see whether interest rates would fall further. When it became clear rates had bottomed, fence-sitters moved.
Second, the festive calendar arrived early. Ganesh Chaturthi fell in September, and Mumbai recorded 5,379 registrations between 14 and 25 September, up 22% year on year. September’s total of 12,622 registrations was the highest for that month in more than 14 years. Developers also rolled out EMI holidays and stamp duty offers to capture that festive demand.
Third, infrastructure is now visible rather than promised. Atal Setu has been open since January 2024, Navi Mumbai International Airport began operations in late 2025, and metro lines are running across the western and eastern suburbs. Buyers respond to completed roads, not announcements, and MMR now has several.
One caution: the RBI raised the repo rate by 25 basis points to 5.50% on 7 October 2026, the first hike since February 2023. That decision came after the quarter closed, so it is not reflected in these MMR housing sales Q3 2026 figures. Q4 numbers will show whether higher EMIs dent demand.
Prices Up 5%: Is the Market Overheating?
A 5% annual rise to Rs 37,064 per sq ft is moderate by Mumbai standards. It is roughly in line with inflation plus a small real gain, and well below the double-digit jumps seen in 2022 and 2023. The luxury segment, which drove much of the earlier price growth, has actually cooled. Homes priced above Rs 10 crore eased about 4% in 2026 so far, even as transaction counts set records. Our analysis of Mumbai’s record Rs 18,512 crore luxury sales explains that split.
The price signal, then, is steady rather than speculative. Developers are holding headline rates but competing harder on payment plans, stamp duty offers and floor-rise waivers. That is typical of a market where supply is catching up with demand.
Our verdict: MMR is in a balanced phase. Demand is real and broad-based, prices are rising at a sustainable 5%, and fresh supply is high. That combination usually favours buyers who compare carefully over those who rush.
Supply vs Demand: What Rising Launches Mean
The 27% jump in MMR launches deserves attention because it changes the balance over the next 12–18 months. When launches outpace sales for several quarters, unsold stock grows and developers become more flexible. Knight Frank’s MMR inventory actually fell 2% to about 1,55,473 units, and quarters-to-sell improved to 6.4 from 6.6. In other words, MMR is absorbing its stock reasonably well for now.
The national picture is different. Top-seven city inventory reached about 6,30,600 units, up roughly 12% year on year. That gap between a tightening MMR and a loosening national market is explored in detail in our post on unsold housing inventory in MMR 2026.
Not all of the new supply is in the same places. Much of the new launch volume sits in Thane’s Ghodbunder and Kolshet belt, the Panvel–Ulwe airport zone and the western suburbs. These are also the corridors with the most infrastructure momentum, which explains why developers are betting on them.
What Q3 2026 Data Means for Your Purchase
Market data is only useful if it changes what you do. Here is how we would translate the Q3 numbers into action for a buyer in the MMR today.
- Lock your loan before rates move further. Several banks raised lending rates by 25 basis points within two days of the October RBI decision. Get a sanction letter now so you know your real budget.
- Compare at least three projects in the same micro-market. With launches up 27%, most corridors now have multiple options at similar price points.
- Ask for the base price separately from offers. Festive discounts are often built into a higher list price. Compare the per sq ft carpet rate, not the offer headline.
- Weigh ready vs under-construction honestly. Ready homes carry no GST and no delivery risk; under-construction homes allow staggered payments. In a 6.4-quarter market, both are available.
- Check the RERA page for every shortlisted project. Confirm completion dates, carpet areas and quarterly progress before paying any booking amount.
- Plan for all-in cost. Stamp duty of 6% (5% for women buyers), registration, GST and maintenance deposits can add 8–12% to the agreement value.
The buyers who did best in 2025 and 2026 were not those who timed the market perfectly. They were the ones who arrived with a loan sanction, a short list and a firm walk-away price.
Where Godrej Properties Fits in the MMR Story
Branded developers have taken a growing share of MMR sales as buyers favour delivery track record over small price gaps. Godrej Properties Limited reported booking value of Rs 8,651 crore in Q1 FY27, up 22%, and has guided Rs 39,000 crore of bookings for the full year. Its Q2 FY27 numbers had not been published at the time of writing.
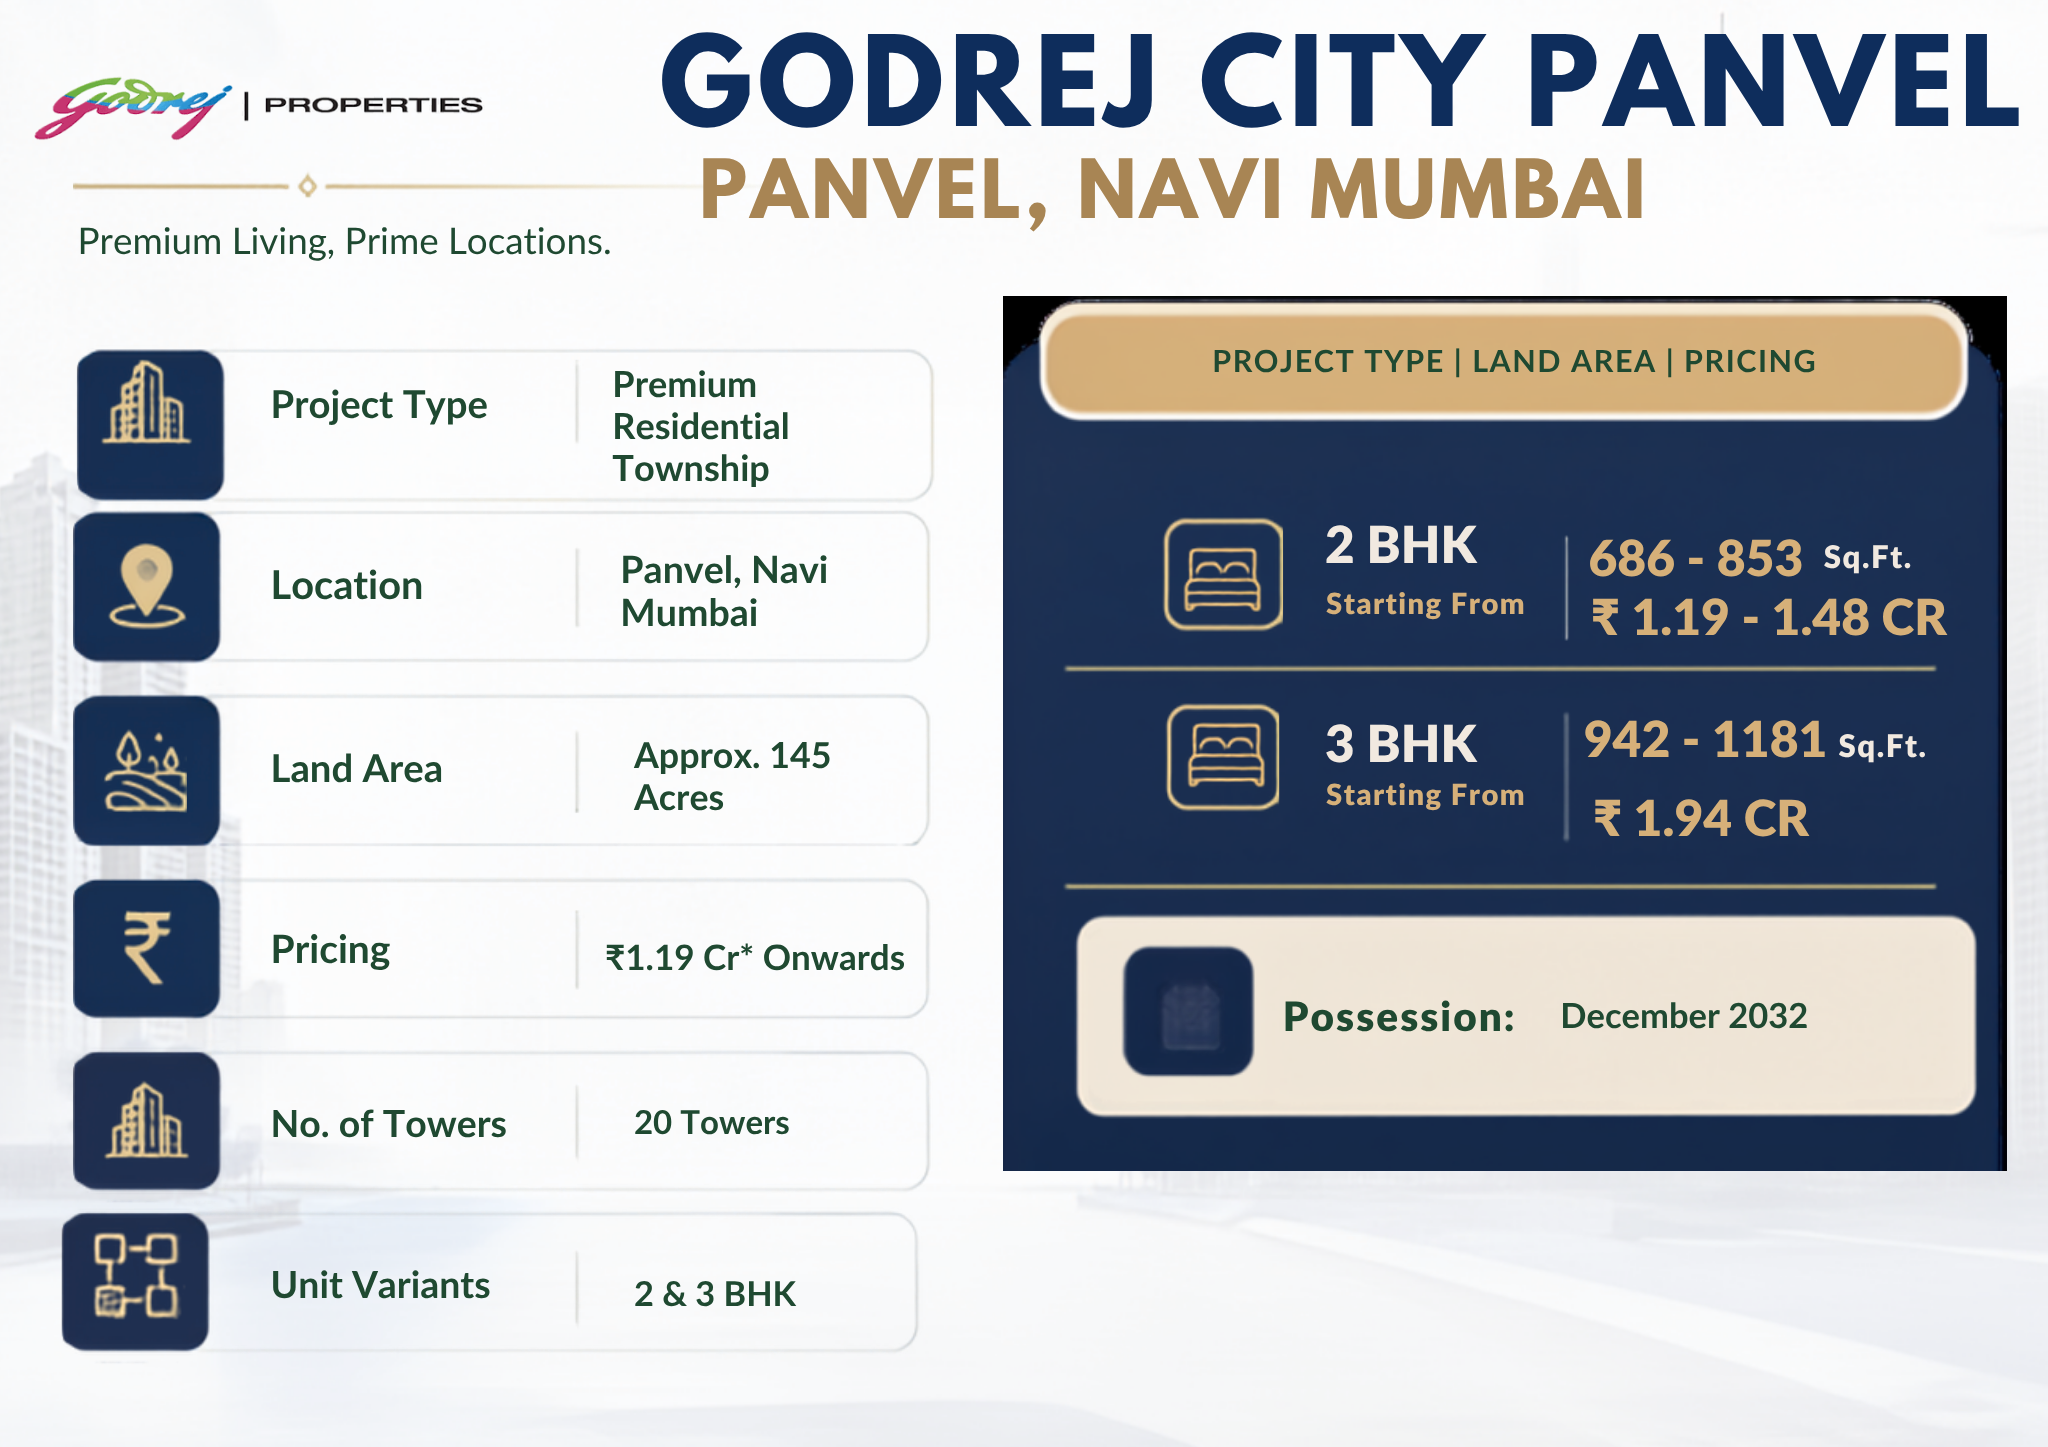
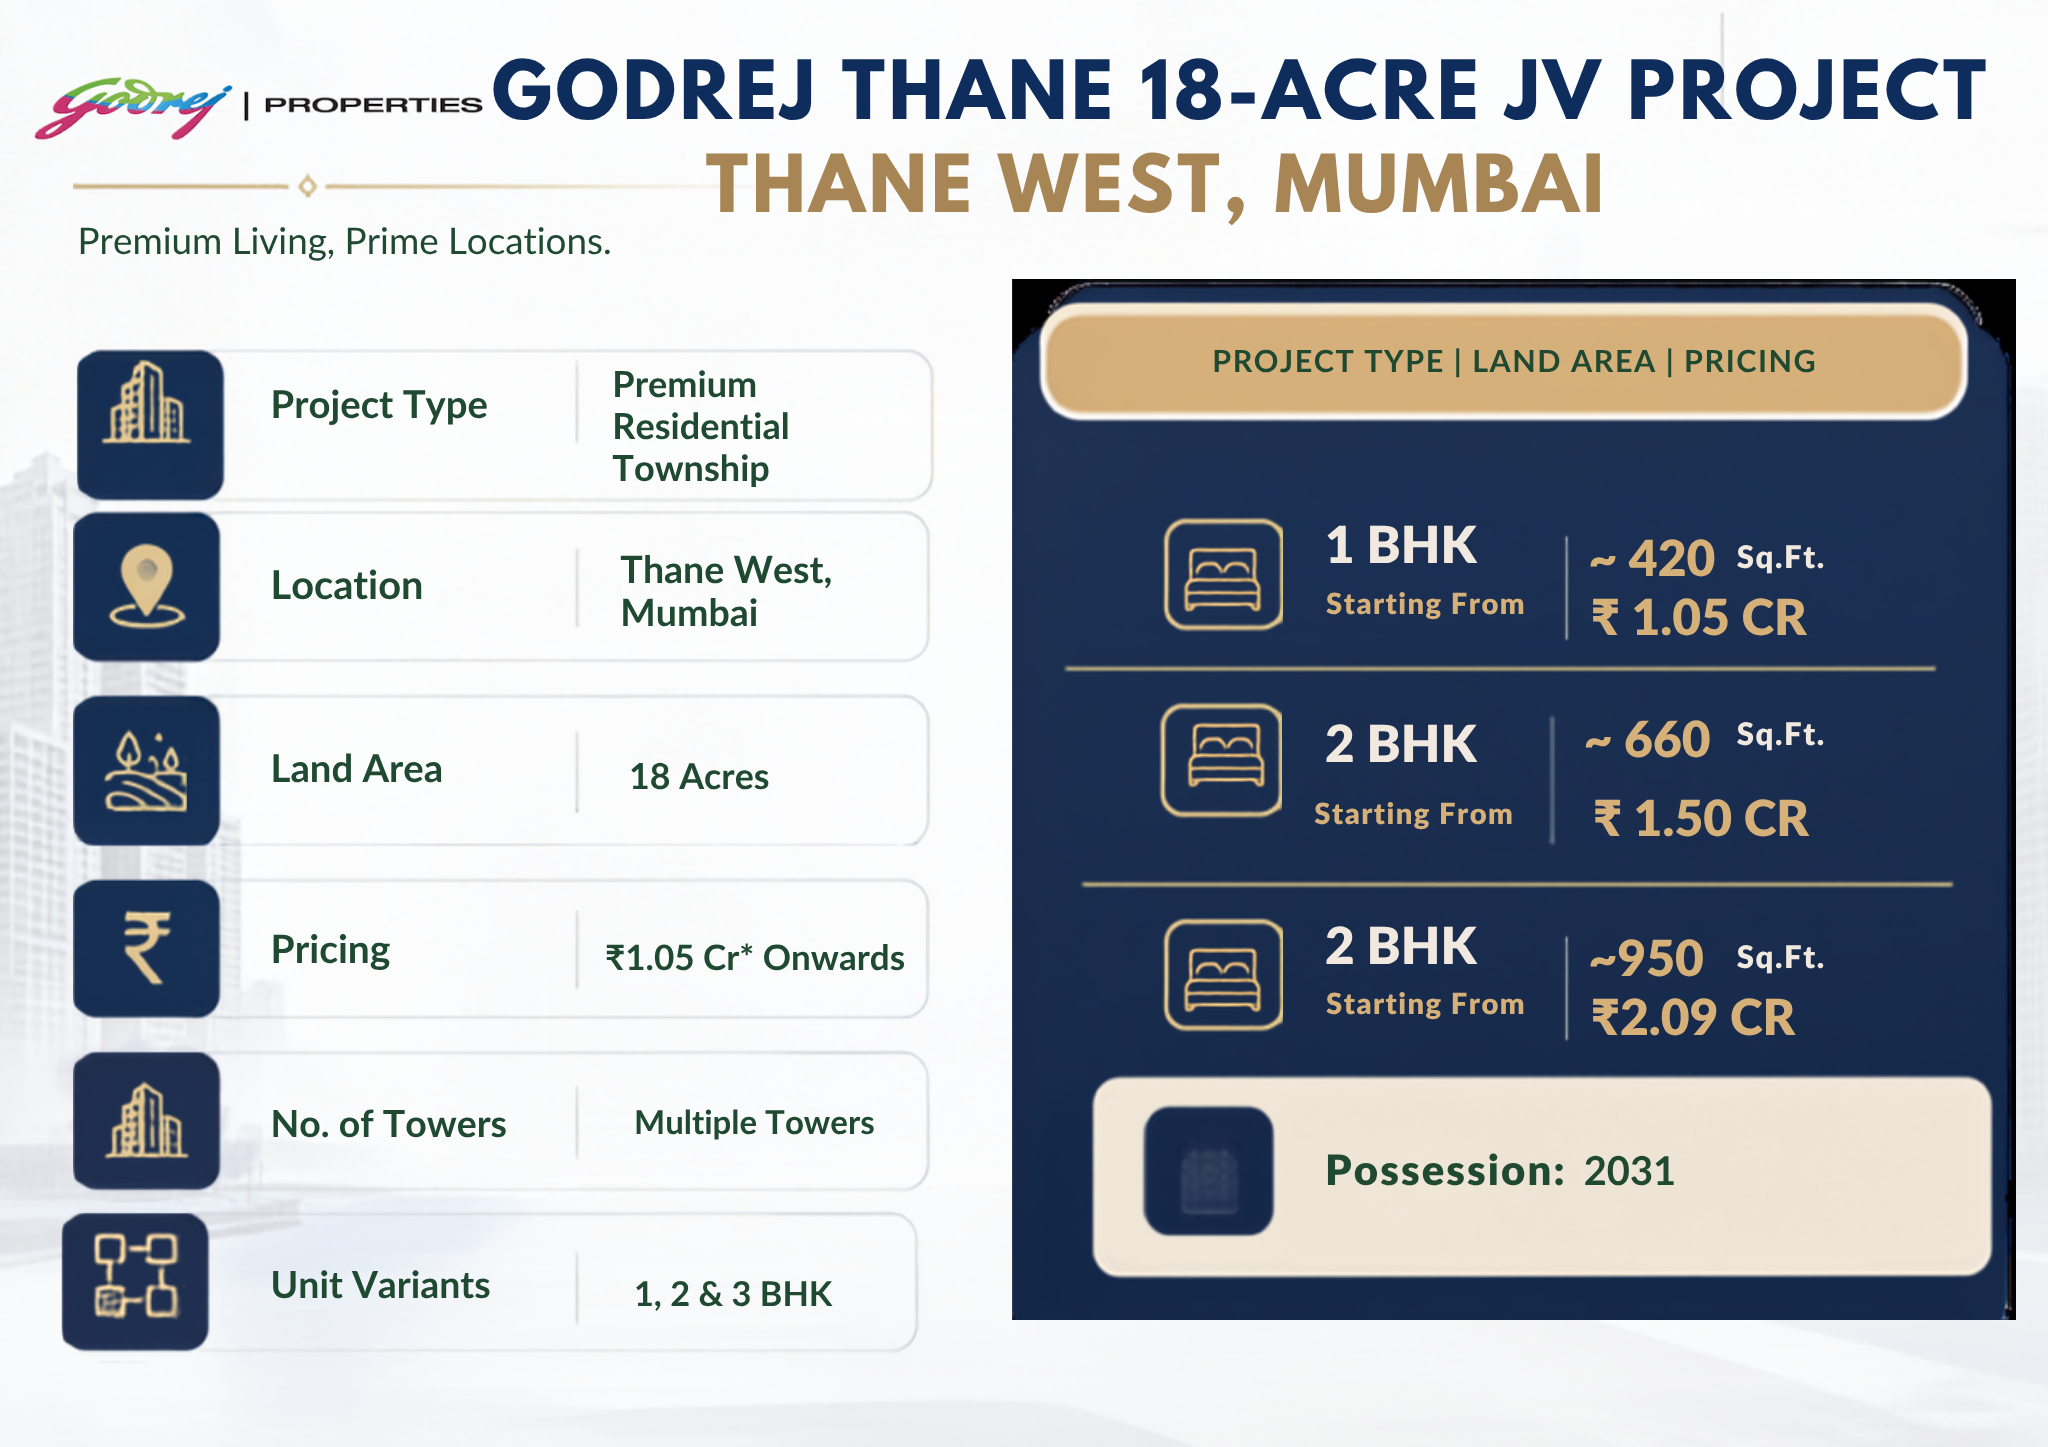
Within the MMR, two projects map neatly onto the corridors where Q3 supply and demand are concentrated. Godrej Ascend on Kolshet Road, Thane sits in the Thane West belt that has absorbed a large share of new launches, with 1, 2 and 3 BHK homes starting around Rs 99 lakh. In Navi Mumbai, Godrej City Panvel gives buyers exposure to the airport zone at a lower entry price than Kharghar or Vashi.
Our team tracks these projects against competitors every quarter, so the comparisons we share reflect current pricing rather than launch brochures.
Frequently Asked Questions
Q: How many homes were sold in MMR in Q3 2026?
Anarock estimates about 31,750 units were sold in the Mumbai Metropolitan Region between July and September 2026, a 5% year-on-year increase. Knight Frank’s own series shows 25,449 units for the quarter and 72,804 units for January to September, the strongest nine-month total since 2018.
Q: Did property prices in Mumbai rise in 2026?
Yes, moderately. Knight Frank puts Mumbai’s weighted average price at Rs 37,064 per sq ft in Q3 2026, up 5% year on year. Luxury homes above Rs 10 crore have eased about 4% so far in 2026, so growth is concentrated in the mid and upper-mid segments.
Q: Why are MMR housing sales Q3 2026 figures different across reports?
Anarock and Knight Frank use different geographies, data sources and definitions of a sale. Anarock tracks primary sales across the wider MMR, while Knight Frank’s series has its own boundaries. Use the direction of change, both of which point up, rather than the exact unit count.
Q: Will the October 2026 repo rate hike affect sales?
Possibly at the margin. The RBI raised the repo rate to 5.50%, and banks such as PNB and Bank of Baroda raised lending rates by 25 basis points. On a Rs 1 crore, 20-year loan, that adds roughly Rs 1,500 a month to the EMI. The effect will show in Q4 2026 data.
Q: Is unsold inventory rising in Mumbai?
Not in MMR as a whole. Knight Frank reports unsold stock down 2% to about 1,55,473 units with 6.4 quarters to sell. Nationally, top-seven city inventory rose about 12% to 6,30,600 units, so MMR is absorbing supply better than most cities.
Q: Which MMR areas are seeing the most new launches?
Neither Anarock nor Knight Frank has published a locality-wise split of Q3 2026 launches, so treat any claim about exactly where new supply landed with caution. What is clear is that Thane West (Ghodbunder and Kolshet), the Panvel–Ulwe airport corridor and the western suburbs have the most visible infrastructure progress, and buyer attention has followed.
Our Take on MMR Housing Sales Q3 2026
The MMR housing sales Q3 2026 data shows a market that is healthy without being overheated. Sales are at multi-year highs, prices are rising about 5%, and new supply is arriving quickly enough to keep developers competitive. For buyers, that is a reasonable window: choice is wide, and headline prices are firm but negotiable on terms.
If you are weighing projects in Thane, Kandivali or Navi Mumbai, our team can share current price sheets and walk you through the trade-offs. You can also explore Godrej Bliss in Kandivali East and book a site visit when you are ready.