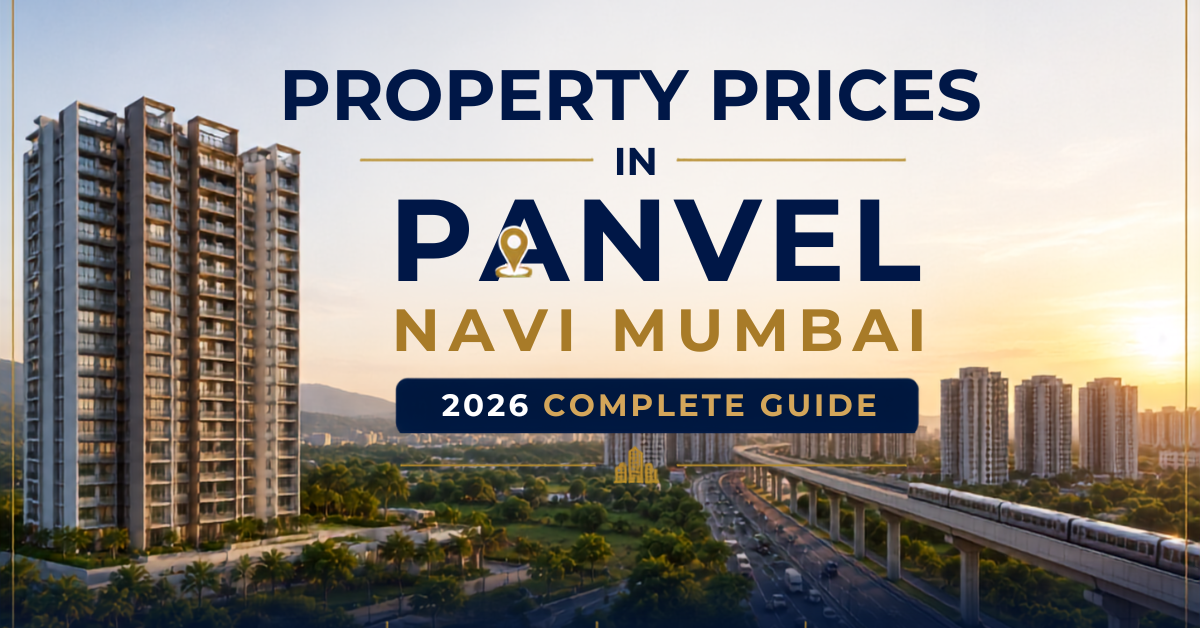
Property Prices in Panvel Navi Mumbai — 2026 Complete Market Guide
Avg Rate: ₹13,750/sqft | 1-Year Growth: 8.7% | 5-Year Growth: 31% | NMIA: Operational | Atal Setu: Live
Our Note: Panvel is in an infrastructure-driven acceleration phase — prices have climbed 8.7% in one year and the NMIA effect is still in its early stages. Entry now captures the steepest part of the appreciation curve.
Panvel Property Market in 2026 — What the Numbers Tell Us
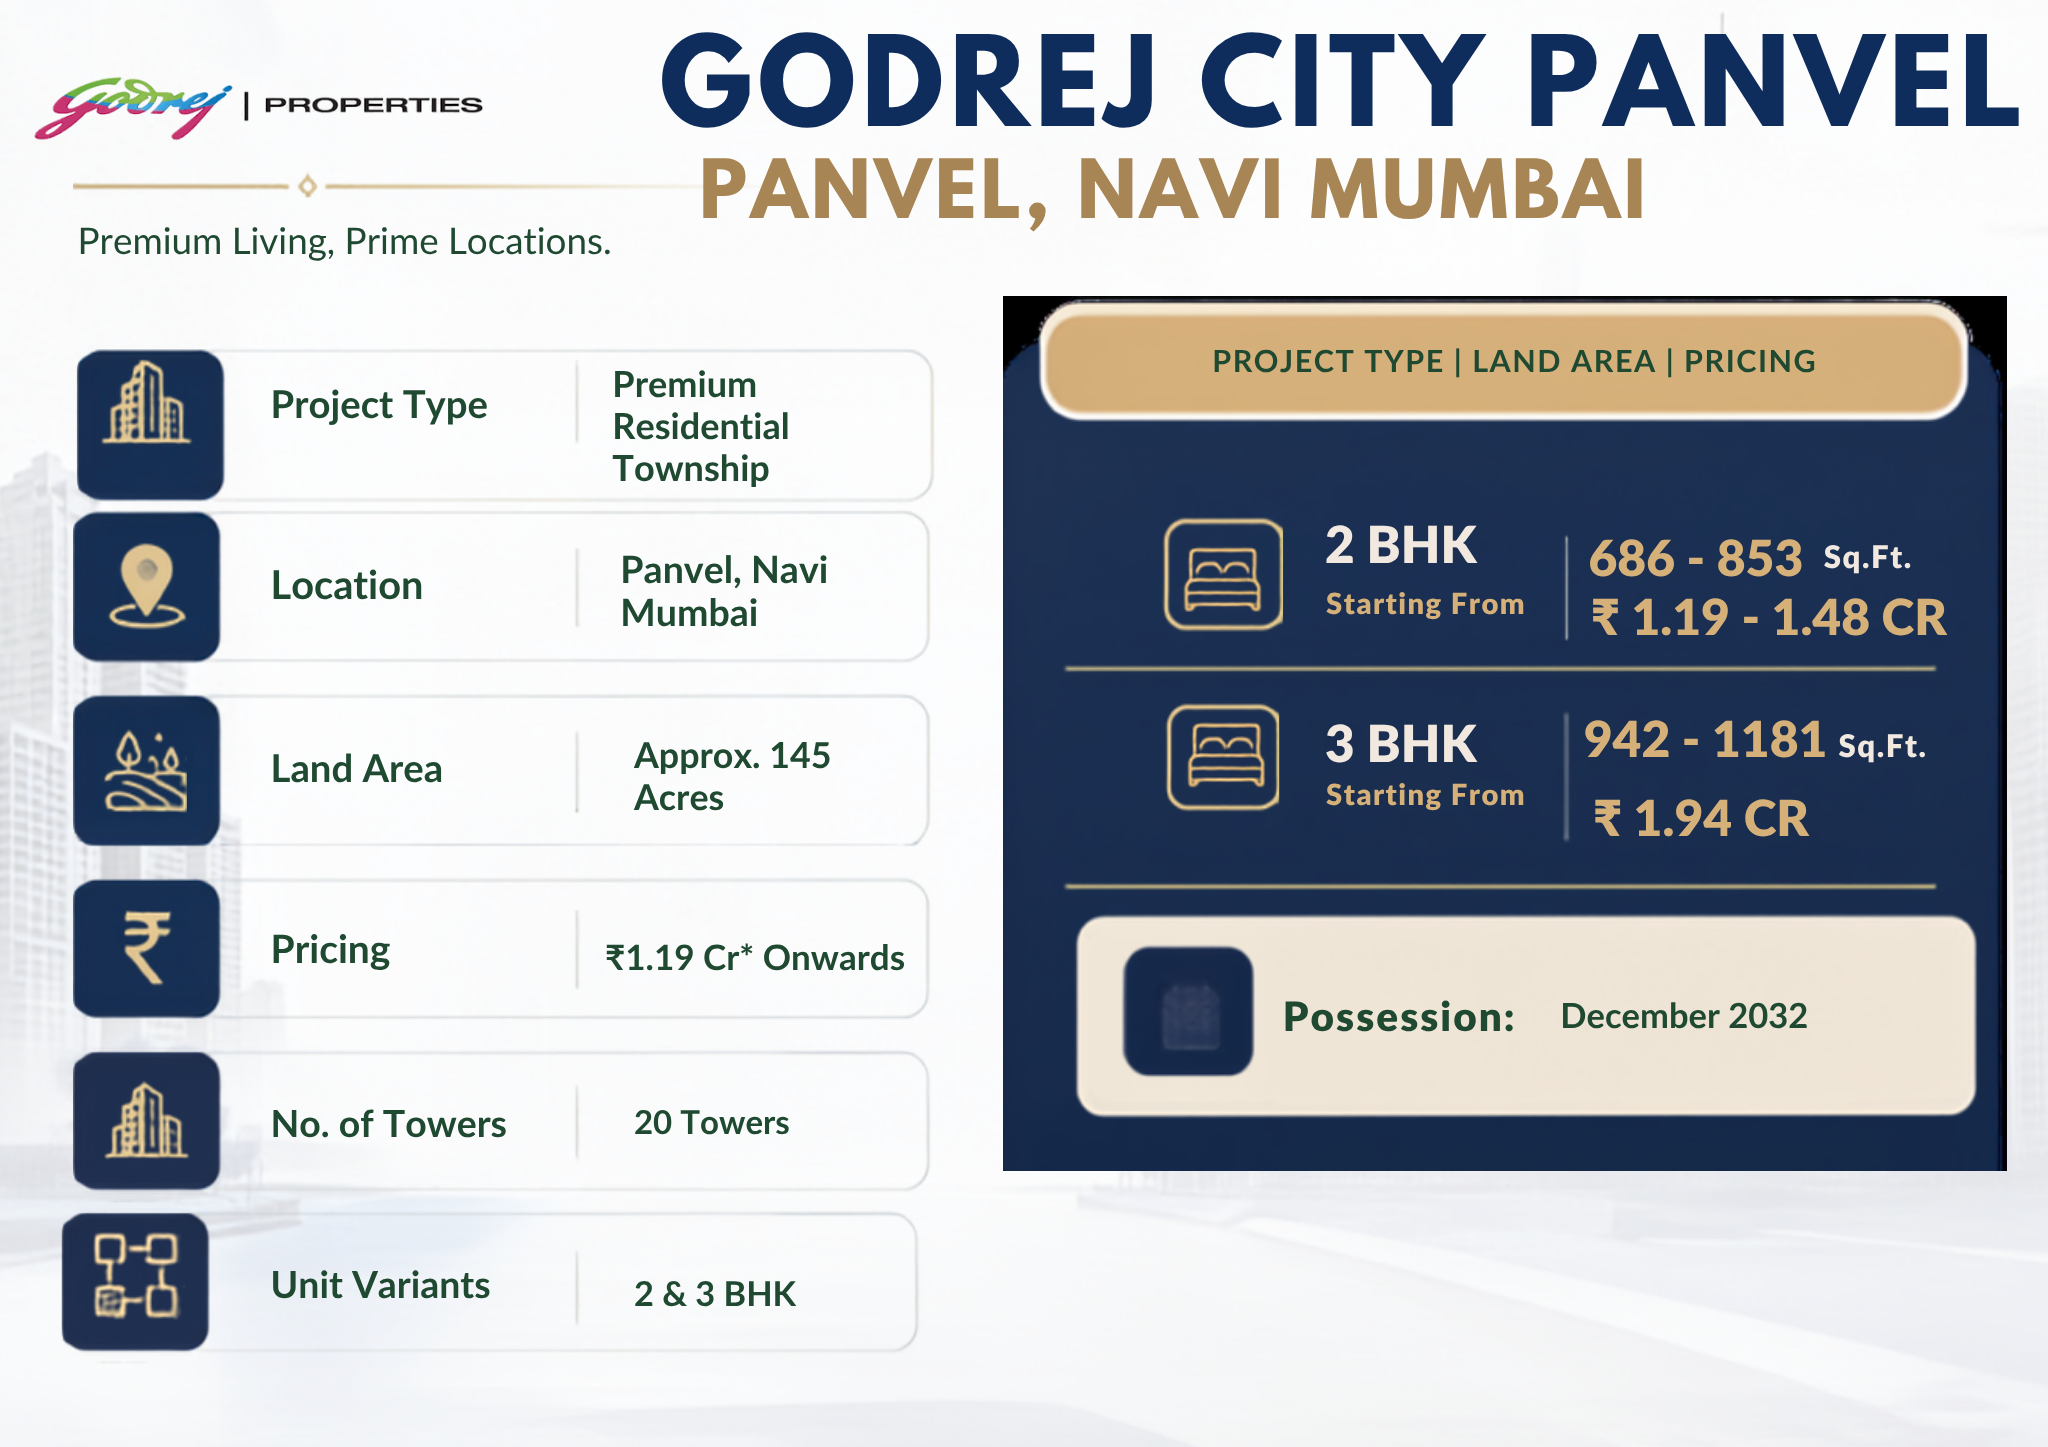
Panvel’s real estate market in 2026 sits at a critical inflection point. Average property rates stand at ₹13,750 per sqft — up 8.7% from the previous year and 31% over five years. The twin catalysts driving this acceleration are the Navi Mumbai International Airport (NMIA), which commenced commercial operations in December 2025, and the Atal Setu (Mumbai Trans Harbour Link), operational since January 2024. Godrej Properties Limited has its 145-acre Godrej City township anchored here — one of the largest branded residential developments in the corridor.
For buyers and investors tracking Panvel prices, the data points are clear: transaction rates have moved from ₹8,000–₹9,000 per sqft in 2020 to ₹13,750 in 2026 — a 53.6% rise over the decade. New-launch pricing from branded developers like Godrej Properties and Hiranandani has crossed ₹14,000–₹17,000 per sqft, establishing a new floor for premium projects. This guide presents a complete breakdown of area-wise rates, historical trends, and our forward projections for the next 3–5 years.
Our analysis draws from IGR Maharashtra transaction data, RERA filing prices, and developer price sheets verified through on-ground checks. We present both average market rates (which include resale and secondary transactions) and new-launch rates (which reflect current developer pricing) — these two metrics can differ by 15–25% and it is essential to understand both.
About Major Developers Active in Panvel
Godrej Properties Limited, founded in 1990 and listed on the NSE since 2010, is Panvel’s most prominent branded developer with the 145-acre Godrej City township (RERA: P52100001106). The developer has delivered 250+ million sq ft across 300+ projects nationally. In Panvel, Godrej also offers plotted development through Godrej Golf Side Estate (villa plots from ₹59.90 Lakh).
Other major developers in the Panvel corridor include Hiranandani Group (Fortune City), L&T Realty, Adani Realty, and Kalpataru. The presence of multiple Tier-1 developers signals institutional confidence in Panvel’s growth trajectory — developers of this caliber commit to locations only after rigorous demand-supply and infrastructure pipeline analysis. The concentration of branded supply also helps establish price floors, preventing the kind of distress pricing that affects localities dominated by smaller builders.
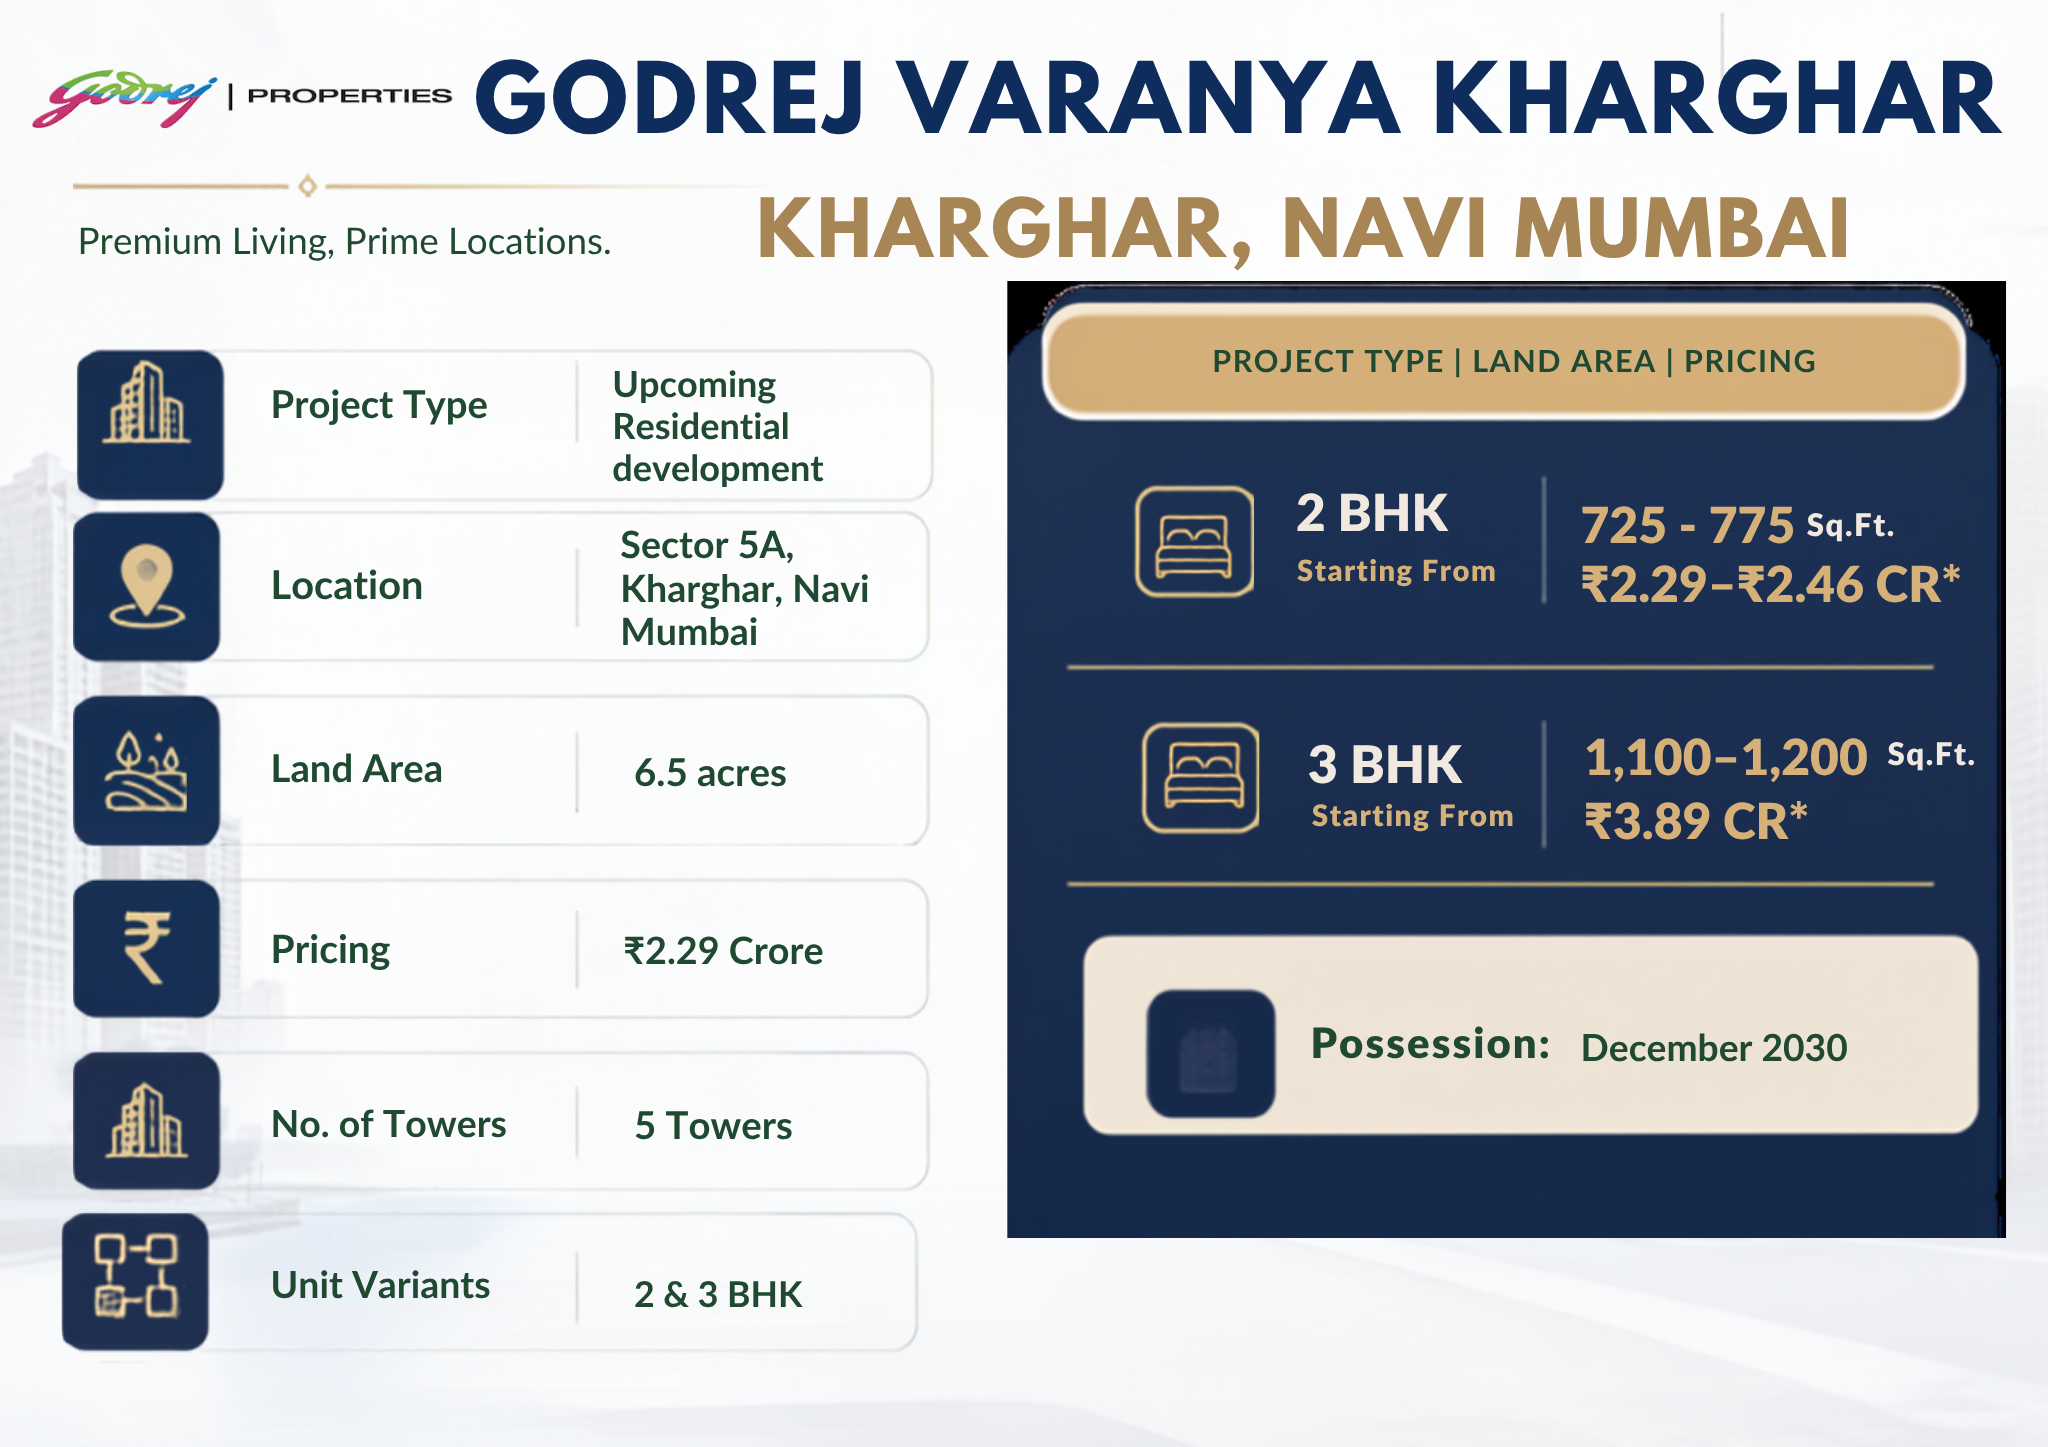
For the broader Navi Mumbai market, Godrej Properties operates Godrej Varanya in Kharghar (2 & 3 BHK from ₹2.29 Cr), giving buyers exposure to different price points within the same developer ecosystem. This portfolio approach allows investors to diversify across Navi Mumbai micro-markets while maintaining consistent construction quality.
Area-Wise Property Rates in Panvel and Surrounding Corridors
| Micro-Market | Avg Rate/Sqft | New Launch Rate | 1-Year Change | 5-Year Change | NMIA Distance |
|---|---|---|---|---|---|
| Panvel (Old) | ₹13,750 | ₹14,000–₹17,000 | +8.7% | +31% | 12–15 km |
| New Panvel | ₹12,500 | ₹13,000–₹15,000 | +7.5% | +28% | 15–18 km |
| Ulwe | ₹11,500 | ₹12,000–₹14,000 | +9.2% | +35% | 8–10 km |
| Kharghar | ₹18,500 | ₹20,000–₹24,000 | +6.3% | +24% | 18–22 km |
| Taloja | ₹9,500 | ₹10,000–₹12,000 | +10.5% | +35% | 20–25 km |
| Vashi | ₹24,000 | ₹26,000–₹30,000 | +4.8% | +18% | 28–32 km |
| Dronagiri | ₹7,500 | ₹8,000–₹10,000 | +12% | +40% | 5–8 km |
The data reveals a clear inverse relationship between current price levels and appreciation rates. Markets closest to NMIA (Dronagiri, Ulwe, Taloja) show the highest percentage growth because they started from the lowest base. Panvel occupies the mid-ground — higher absolute rates than the emerging nodes but significantly stronger infrastructure and social amenities. The 8.7% annual growth at ₹13,750/sqft represents the optimal intersection of affordability and established livability.
Established nodes like Vashi (₹24,000/sqft) and Kharghar (₹18,500/sqft) show declining growth rates of 4.8% and 6.3% respectively — typical of mature markets approaching price plateaus. For investors, this means the highest returns in Navi Mumbai over the next 5 years will come from mid-maturity markets like Panvel, not from established nodes that have already priced in their infrastructure advantages.
New launch rates from branded developers in Panvel (₹14,000–₹17,000/sqft) sit 10–25% above market averages — this premium reflects brand value, construction quality, and amenity infrastructure. Godrej City Panvel at ₹14,000–₹15,500/sqft represents the lower end of the branded range, making it among the most competitively priced Tier-1 developer projects in the corridor.
Historical Price Trends — 5-Year and 10-Year Analysis
| Year | Panvel Avg Rate/Sqft | YoY Change | Key Catalyst |
|---|---|---|---|
| 2016 | ₹8,500 | — | NMIA land acquisition announced |
| 2018 | ₹9,200 | +4.1% (avg) | NMIA construction begins |
| 2020 | ₹9,500 | +1.6% (avg) | COVID impact, market stagnation |
| 2022 | ₹10,800 | +6.8% (avg) | Post-COVID recovery, MTHL progress |
| 2024 | ₹12,650 | +8.6% (avg) | Atal Setu opens (Jan 2024) |
| 2025 | ₹12,900 | +2% (H1) then +6.7% (H2) | NMIA commercial ops begin (Dec 2025) |
| 2026 (Current) | ₹13,750 | +8.7% | NMIA ramp-up, metro planning |
The historical data shows two distinct phases in Panvel’s price trajectory. From 2016 to 2020, growth was muted at 2–4% annually — the market was in a “promise” phase where NMIA and connectivity upgrades were announced but not delivered. From 2022 onwards, as Atal Setu and NMIA moved from construction to operational status, appreciation accelerated sharply to 7–9% annually. This pattern — slow growth during construction, acceleration during commissioning — is consistent with airport-linked real estate markets globally.
The critical insight for 2026 buyers is that Panvel is still in the early phase of the acceleration curve. NMIA is operating but has not yet reached full capacity. The Panvel–Karjat suburban rail corridor is 85% complete but not yet open. Metro Lines 2, 3, and 4 are planned but not under construction. Each of these catalysts, as it materialises, will add another layer of demand — and price support. Markets that have already priced in their infrastructure (like Vashi) show plateauing growth; Panvel has not yet priced in all its pipeline catalysts.
Where Are Panvel Prices Headed? — Our 3-Year and 5-Year Projections
| Scenario | 2027 Projected Rate | 2029 Projected Rate | 2031 Projected Rate |
|---|---|---|---|
| Conservative (6% annual) | ₹14,575 | ₹16,375 | ₹18,400 |
| Moderate (8.5% annual) | ₹14,920 | ₹17,550 | ₹20,650 |
| Optimistic (12% annual) | ₹15,400 | ₹19,325 | ₹24,225 |
Under the moderate scenario — which assumes Panvel maintains its current 8.7% growth rate rounded to 8.5% — average rates should cross ₹20,000/sqft by 2031. This would bring Panvel in line with where Kharghar is today. The optimistic case factors in a full NMIA scale-up effect: if the airport reaches 20 million passengers annually by 2030, commercial and residential demand around Panvel will intensify, potentially pushing rates to ₹24,000+/sqft.
For buyers purchasing at Godrej City Panvel’s current ₹14,000–₹15,500/sqft, even the conservative projection (₹18,400/sqft by 2031) implies a 20–32% capital gain on the per-sqft rate alone. When combined with the carpet area and total apartment value, this translates to ₹25–50 Lakh in absolute gains on a 2 BHK unit over 5 years. The risk of price stagnation is minimal given the infrastructure pipeline — it would require a simultaneous failure of NMIA expansion, metro construction, and suburban rail completion.
One important caution: these projections assume normalised market conditions without major macroeconomic shocks (interest rate spikes, regulatory changes). The RBI’s monetary policy trajectory — currently accommodative for housing — supports continued demand. However, buyers should factor in a 6–12 month buffer on their investment timelines to account for any temporary market softening.
Buyer Guidance — When and Where to Buy in Panvel
The optimal buying window in Panvel is now through Q2 2027 — before NMIA scales to full capacity and the Panvel–Karjat rail corridor opens. Both catalysts will trigger the next wave of demand and price re-rating. Within Panvel, the Old Panvel highway corridor (where Godrej City is located) offers the best balance of current livability and appreciation potential — it is already an established residential zone with schools, hospitals, and retail infrastructure, unlike emerging nodes like Dronagiri or New Panvel East that still lack social amenities.
Branded developer projects in the ₹14,000–₹17,000/sqft range represent the safest investment grade. These projects come with RERA compliance, home loan pre-approvals from major banks, and construction quality guarantees that de-risk the purchase. Resale properties in Panvel at ₹11,000–₹13,000/sqft offer lower entry prices but carry risks around society management quality, structural condition, and loan availability. For first-time buyers, we recommend new branded projects for the regulatory and quality protections they provide.
For a project-specific buying guide, read our step-by-step buying guide for Godrej City Panvel, which covers costs, documents, home loan options, and the complete purchase timeline. For investment-focused analysis, our Godrej City Panvel ROI analysis provides scenario-wise return projections.
Our Market Outlook — Panvel in 2026 and Beyond
Panvel’s real estate market in 2026 is in the strongest position it has ever been. The convergence of NMIA operations, Atal Setu connectivity, Mumbai–Pune Expressway access, and upcoming metro and suburban rail expansions creates a multi-layered demand structure that insulates against single-point-of-failure risks. Unlike markets that depend on one employer or one infrastructure project, Panvel’s growth is diversified across transport, aviation, logistics, and residential demand drivers.
The supply side is equally healthy. Major developers are actively launching new phases and projects in Panvel, indicating confidence in sustained demand. Godrej Properties’ decision to expand Godrej City into additional phases — after successfully delivering and occupying earlier ones with 3,000+ families — is a strong signal of continued market depth. The developer’s pricing at ₹14,000–₹15,500/sqft sets a competitive floor that attracts both end-users and investors.
Our forecast: Panvel will cross ₹18,000/sqft average by 2029 and ₹20,000/sqft by 2031 under moderate growth assumptions. The market is transitioning from “infrastructure promise” to “infrastructure delivery” — and historically, that transition phase delivers the highest returns for early buyers. If you are evaluating Panvel, the data points unequivocally toward entering the market now rather than waiting for further price confirmation.
Q1. What is the current property rate per sqft in Panvel?
The average property rate in Panvel as of 2026 is ₹13,750 per sqft. New-launch rates from branded developers range from ₹14,000 to ₹17,000 per sqft. Resale properties trade between ₹11,000 and ₹13,000 per sqft. These rates have increased 8.7% year-on-year and 31% over the last 5 years.
Q2. Will Panvel property prices increase further in 2026–2027?
Yes — all indicators point to continued price growth. NMIA is still ramping up operations, the Panvel–Karjat rail corridor is 85% complete, and metro lines are planned. Under moderate projections, Panvel should reach ₹15,000–₹17,500/sqft by end of 2027. The acceleration phase typically lasts 3–5 years from infrastructure commissioning.
Q3. Is Panvel cheaper than Kharghar for property?
Yes — Panvel averages ₹13,750/sqft compared to Kharghar’s ₹18,500/sqft, a 26% cost advantage. A 2 BHK in Panvel costs ₹72 Lakh–₹1.20 Cr versus ₹1.10–₹1.60 Cr in Kharghar. However, Panvel’s appreciation rate (8.7%) exceeds Kharghar’s (6.3%), narrowing the gap over time.
Q4. What are the most affordable areas near Panvel for property?
Dronagiri (₹7,500/sqft), Taloja (₹9,500/sqft), and New Panvel (₹12,500/sqft) offer lower rates than Old Panvel. However, these areas have less developed social infrastructure — fewer schools, hospitals, and retail options. Old Panvel offers the best balance of price and livability among the sub-₹15,000/sqft Navi Mumbai markets.
Q5. How does NMIA affect Panvel property prices?
NMIA (12 km from Panvel) has been the primary price catalyst. Since airport construction began, Panvel prices rose from ₹9,200/sqft (2018) to ₹13,750/sqft (2026) — a 49% increase. Airport-adjacent markets in Indian cities historically deliver 40–60% higher appreciation than city averages in the decade post-commissioning.
Invest in Panvel’s Growth Story
Explore Godrej City Panvel — 1, 2 & 3 BHK from ₹79 Lakh and Godrej Golf Side Estate — Villa Plots from ₹59.90 Lakh for two entry points into Panvel’s most trusted developer.